Why demand forecasting
Almost every logistics decision depends on how much will be sold: how much to buy or produce, how much inventory to hold, how many warehouse staff to plan and how many vehicles to hire. A forecasting error leads to stock-outs or excess inventory, and both have a cost.
In many companies forecasts are made with spreadsheets and the team’s experience. This works reasonably well for stable products, but struggles with seasonality, promotions or changes in trend.
What a forecasting model adds
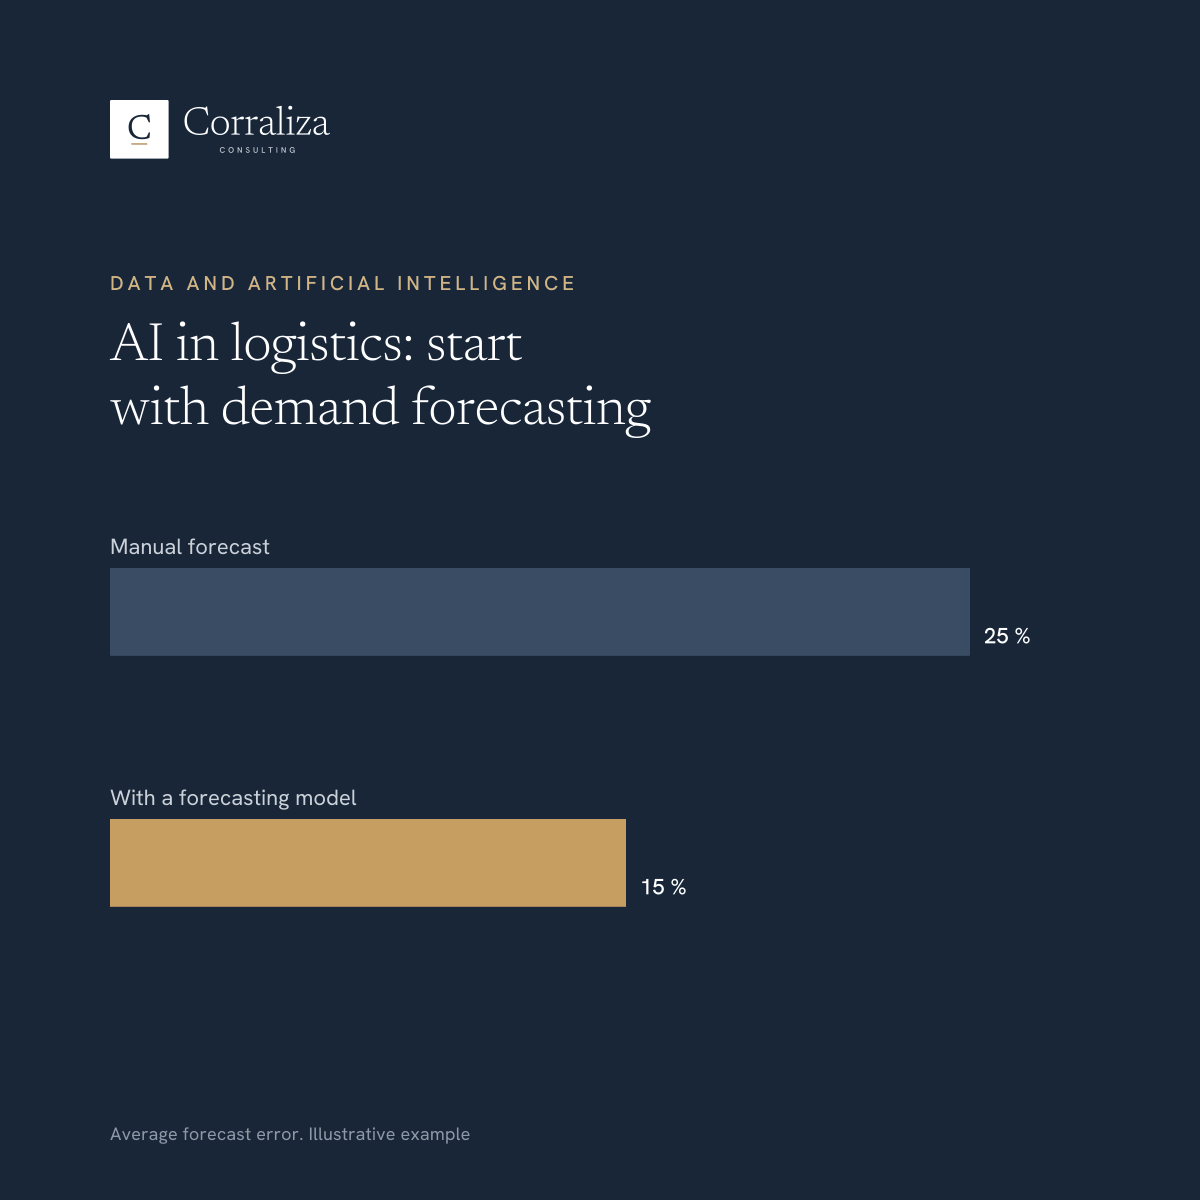
A forecasting model learns from historical sales and from other factors that influence them: calendar, public holidays, promotions, prices or weather. In the illustrative example in the chart, the average error falls from 25% with manual forecasting to 15% with the model.
An improvement of this kind makes it possible to reduce safety stock without lowering service levels, or to improve service with the same inventory. The result depends on each company and should be measured on its own data.
What you need to start
- Sales history by product and, if possible, by customer or point of sale, ideally two years or more.
- Context information: promotions, price changes, product launches and discontinuations.
- An agreed error measure to compare the current forecast with the model’s.
- A specific use for the forecast: purchasing, production, inventory or warehouse planning.
Common mistakes
- Starting with the tool. Choosing software before defining which decision you want to improve usually ends in an expensive project that is little used.
- Forecasting sales instead of demand. If there were stock-outs, recorded sales are lower than what customers asked for. The history should be corrected before training the model.
- Not measuring. Without comparing the error before and after, it is impossible to know whether the model improves the forecast or what that improvement is worth.
How to approach the project
It is advisable to start with a limited pilot: one product family or one warehouse, over a few months, comparing the model’s forecast with the usual one. If the improvement is clear, it is extended to the rest. The model does not replace the team: it gives them a more reliable basis on which to apply their market knowledge.
Data quality is usually the main obstacle. That is why the first step is often to organise sales information in a business intelligence system, which also serves to monitor the project itself.