Profitability analysis usually starts from the selling price and the product cost. With those two figures, all customers look alike. In practice, each customer generates different costs depending on how they buy, how they are delivered to and what commercial terms they have.
From list price to real margin
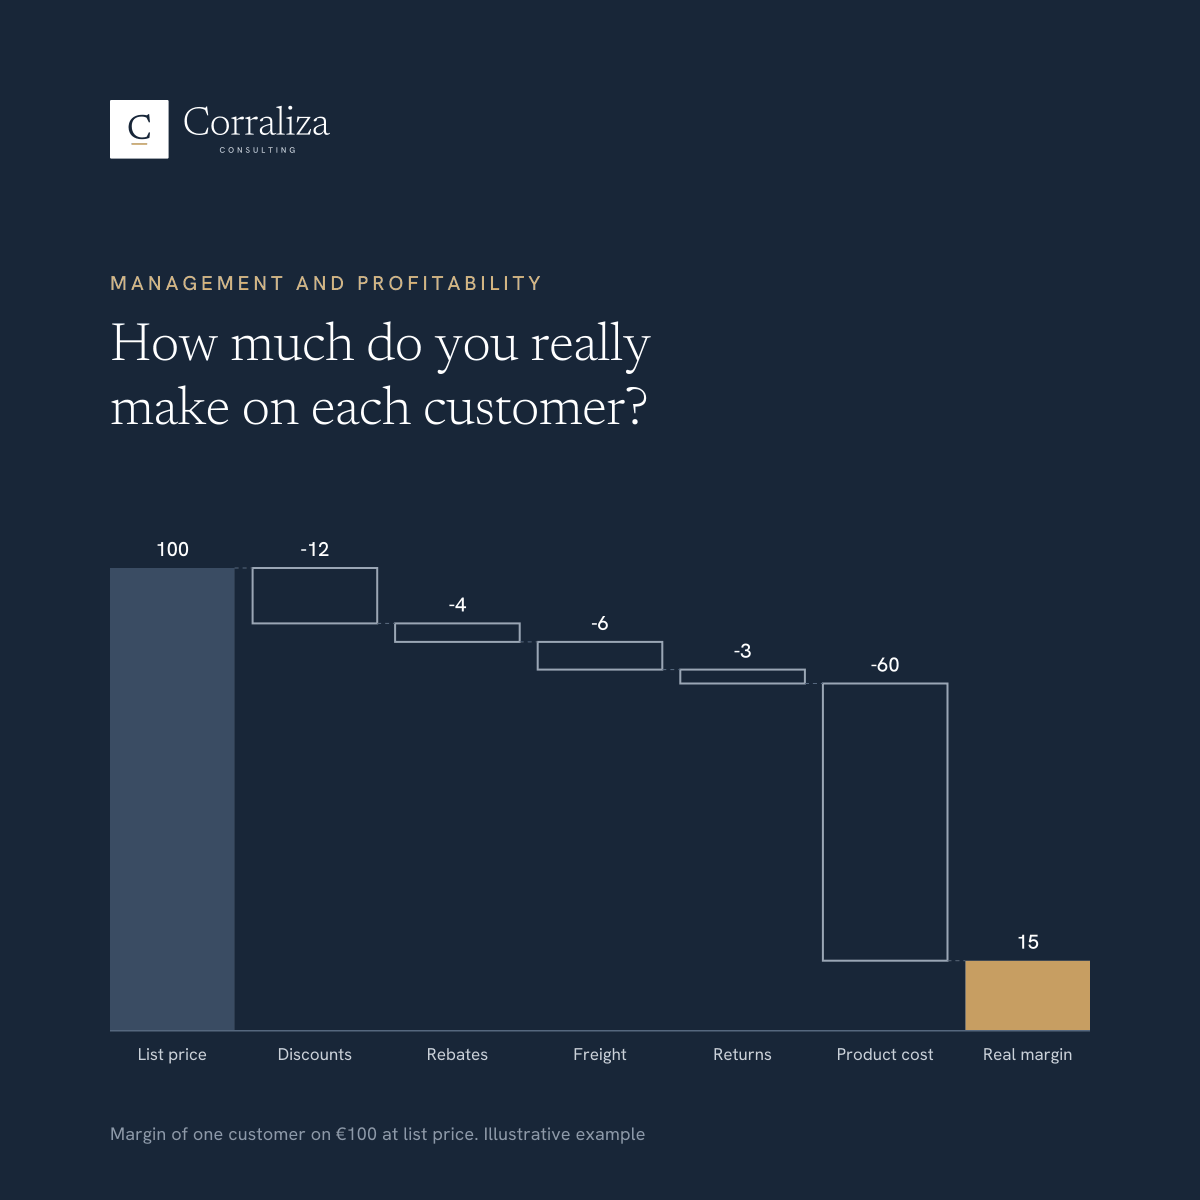
The chart shows an illustrative example based on €100 of sales at list price:
- Commercial discounts: €12.
- Volume rebates at year end: €4.
- Freight paid by the company: €6.
- Returns and credit notes: €3.
- Product cost: €60.
The result is a margin of €15. If only discounts and product cost were deducted, the apparent margin would be €28, almost twice as much.
Why it does not show in the accounts
The accounts record all these items, but in general ledger accounts: freight under transport, rebates in a year-end provision and returns as credit notes. None of them is automatically assigned to the customer who causes it. That is why two customers with the same turnover can contribute very different results without anyone noticing.
How to calculate it in your company
- Start from sales per customer at list price, not net price.
- Assign each customer its actual discounts, rebates and credit notes for the period.
- Allocate freight according to actual shipments: number of deliveries, type of shipment and destination.
- Where relevant, add the cost to serve: picking small orders, payment terms or sales support.
- Rank customers by real margin and compare it with their turnover.
The analysis usually shows that a small group of customers accounts for most of the profit, and that some customers with good turnover have a very low or even negative margin.
Common mistakes
- Allocating costs in proportion to sales. It is simple, but it makes all customers look equally profitable, which is exactly what you want to avoid. Each cost should be assigned according to what drives it: the number of shipments, the number of orders or actual returns.
- Analysing a single month. Rebates, campaigns and returns are concentrated at specific times of the year. It is best to work with twelve months to get a reliable picture.
- Ignoring payment terms. A customer who pays at 120 days requires you to finance their purchases for four months. For companies with tight margins, this financial cost matters.
- Seeking excessive precision. There is no need to allocate every euro. The four or five most important items are enough to rank customers and make decisions.
What to do with the result
The aim is not to drop customers, but to decide with information: review commercial terms, set minimum order sizes, adjust the freight policy or focus sales effort on the customers that contribute most. If the data is updated regularly, for example in a dashboard, monitoring no longer depends on estimates.